WHAT'S IN THE FILES, WHAT DOES THE RAW DATA LOOK LIKE
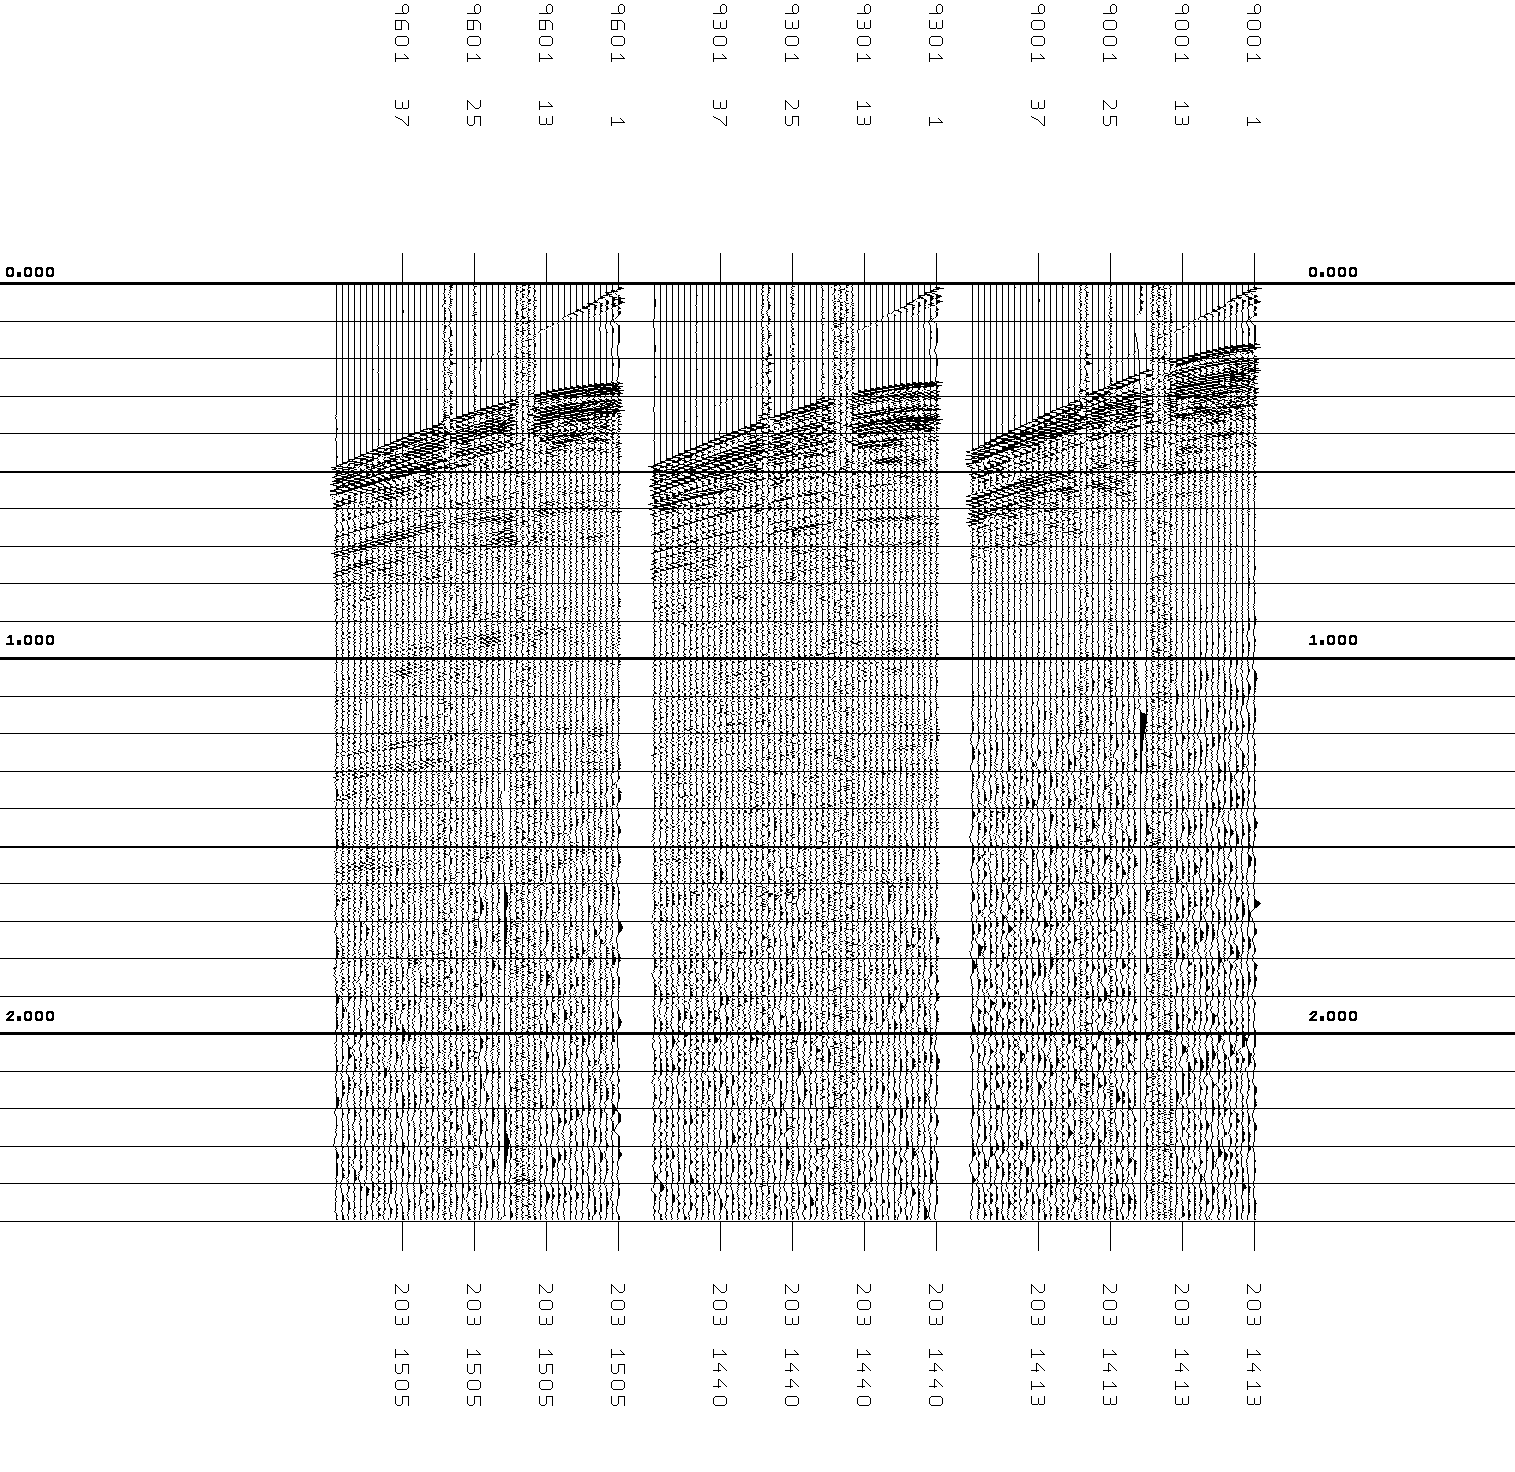
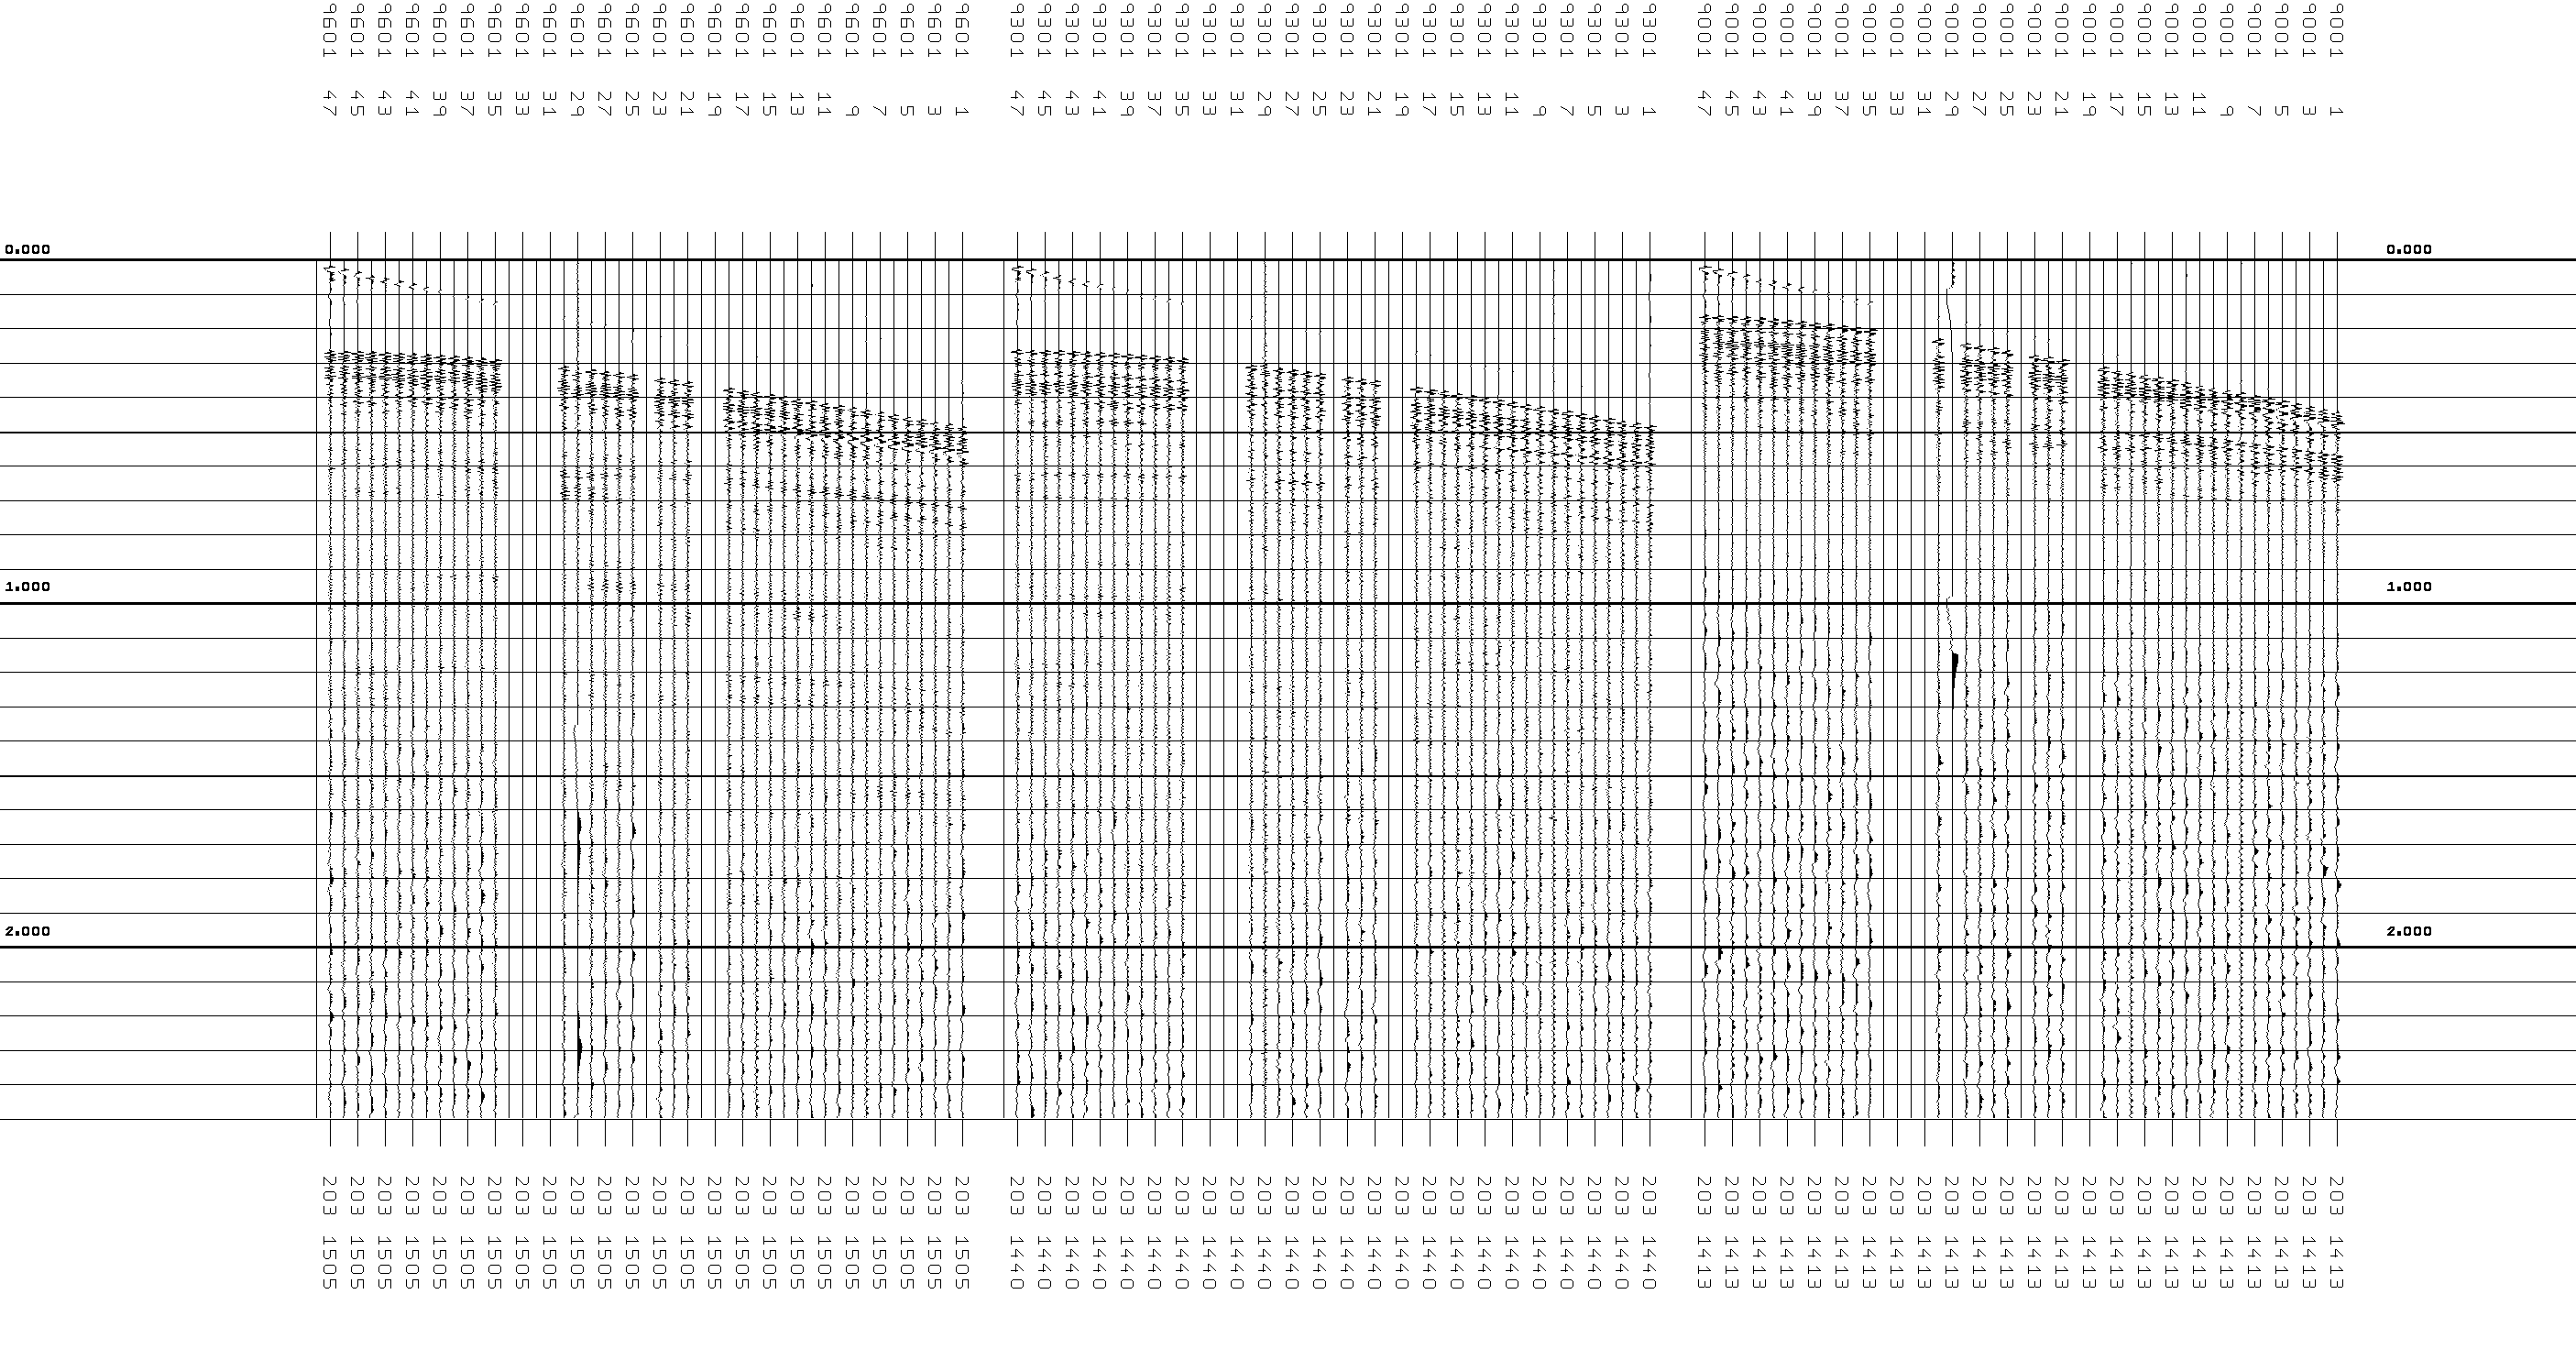
520>ls *segy* day203-1413z.segy day203-1440z.segy day203-1505z.segy day203-1413zRen.segy day203-1440zRen.segy day203-1505zRen.segy day203-1413zRev.segy day203-1440zRev.segy day203-1505zRev.segyPlot shows the first shot of each *z.segy file. Trace 1 is closest to the guns. The warning about the number of samples/trace in the segy binary header vs what is actually in each trace is a classic non-geophysist programmer. The first sample is time 0 and the last sample is at an even second. e.g. a 1s record has times 0-1.0, not 0-.999
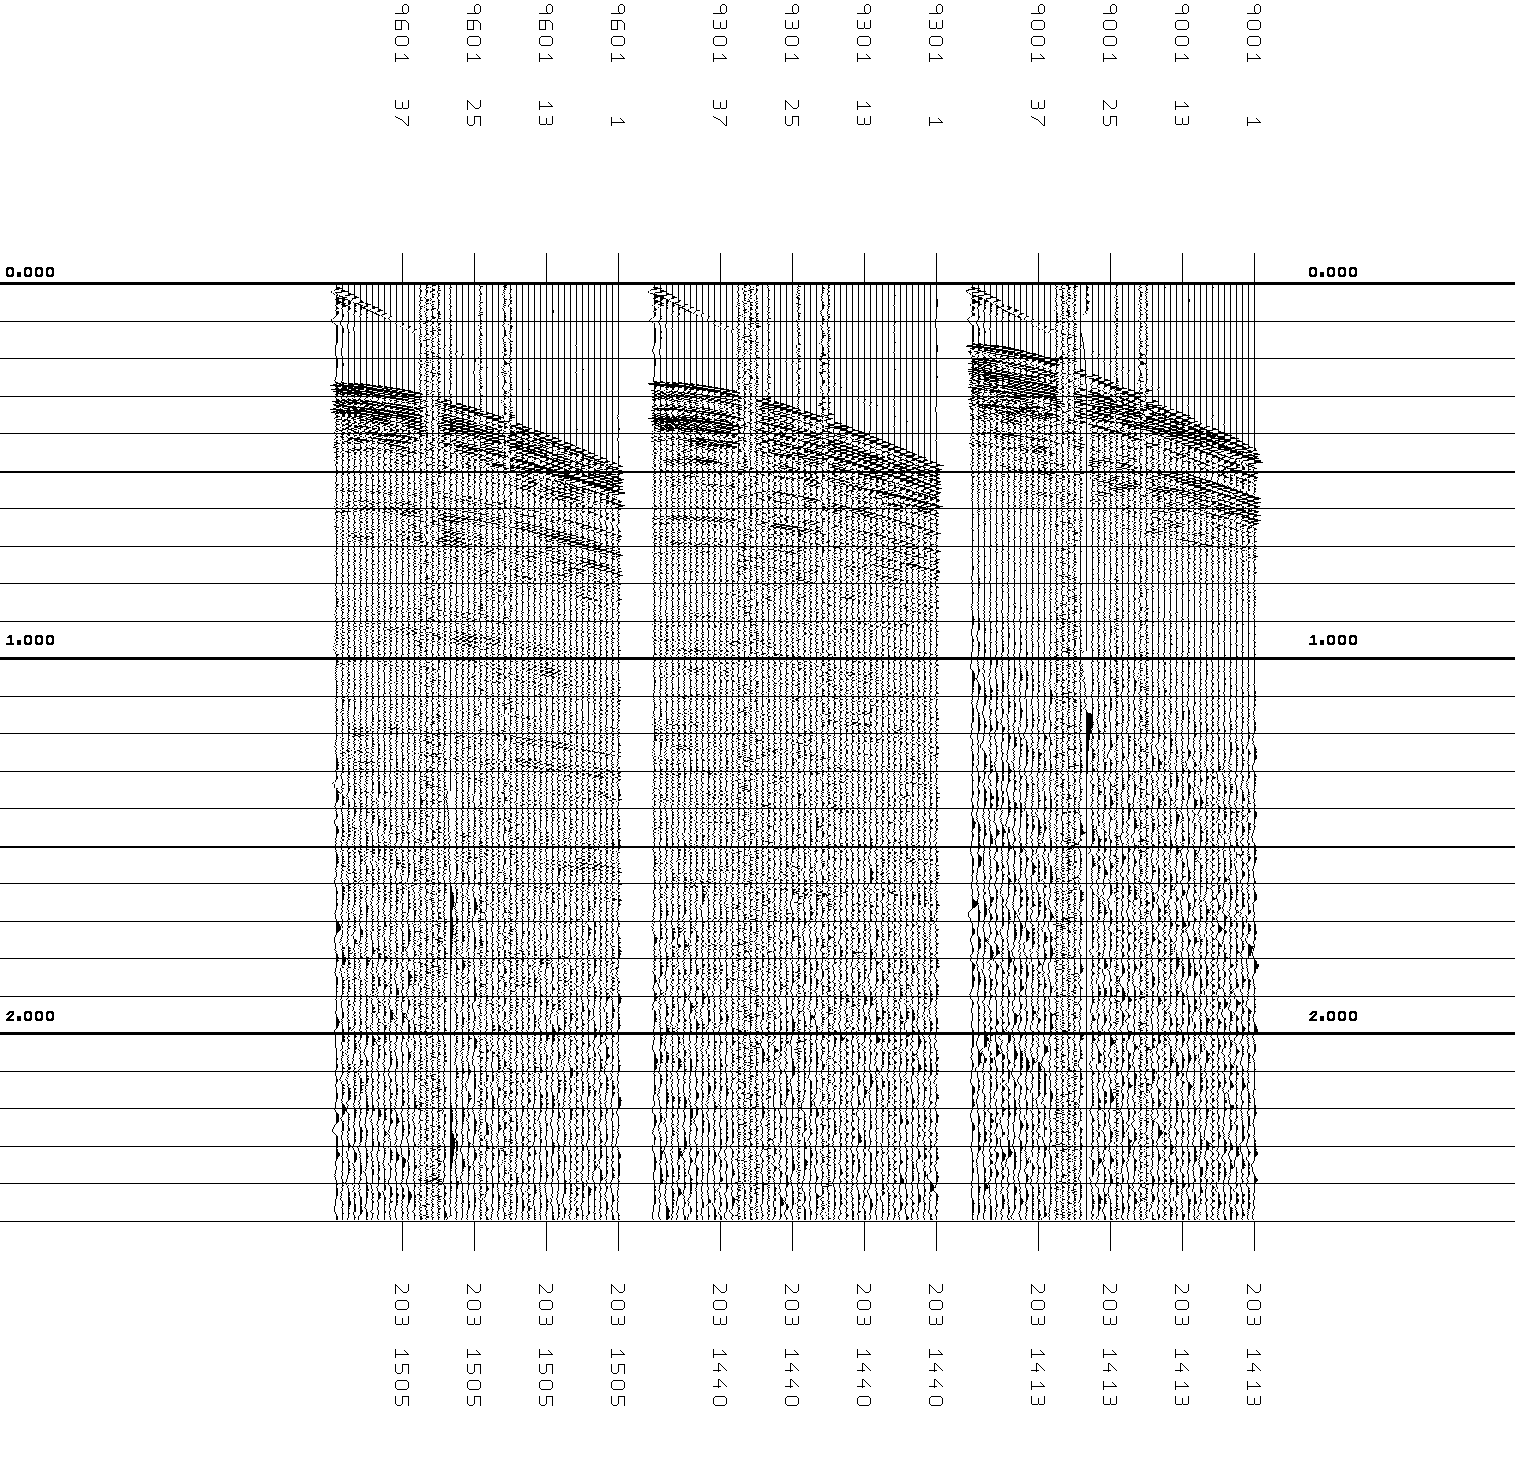
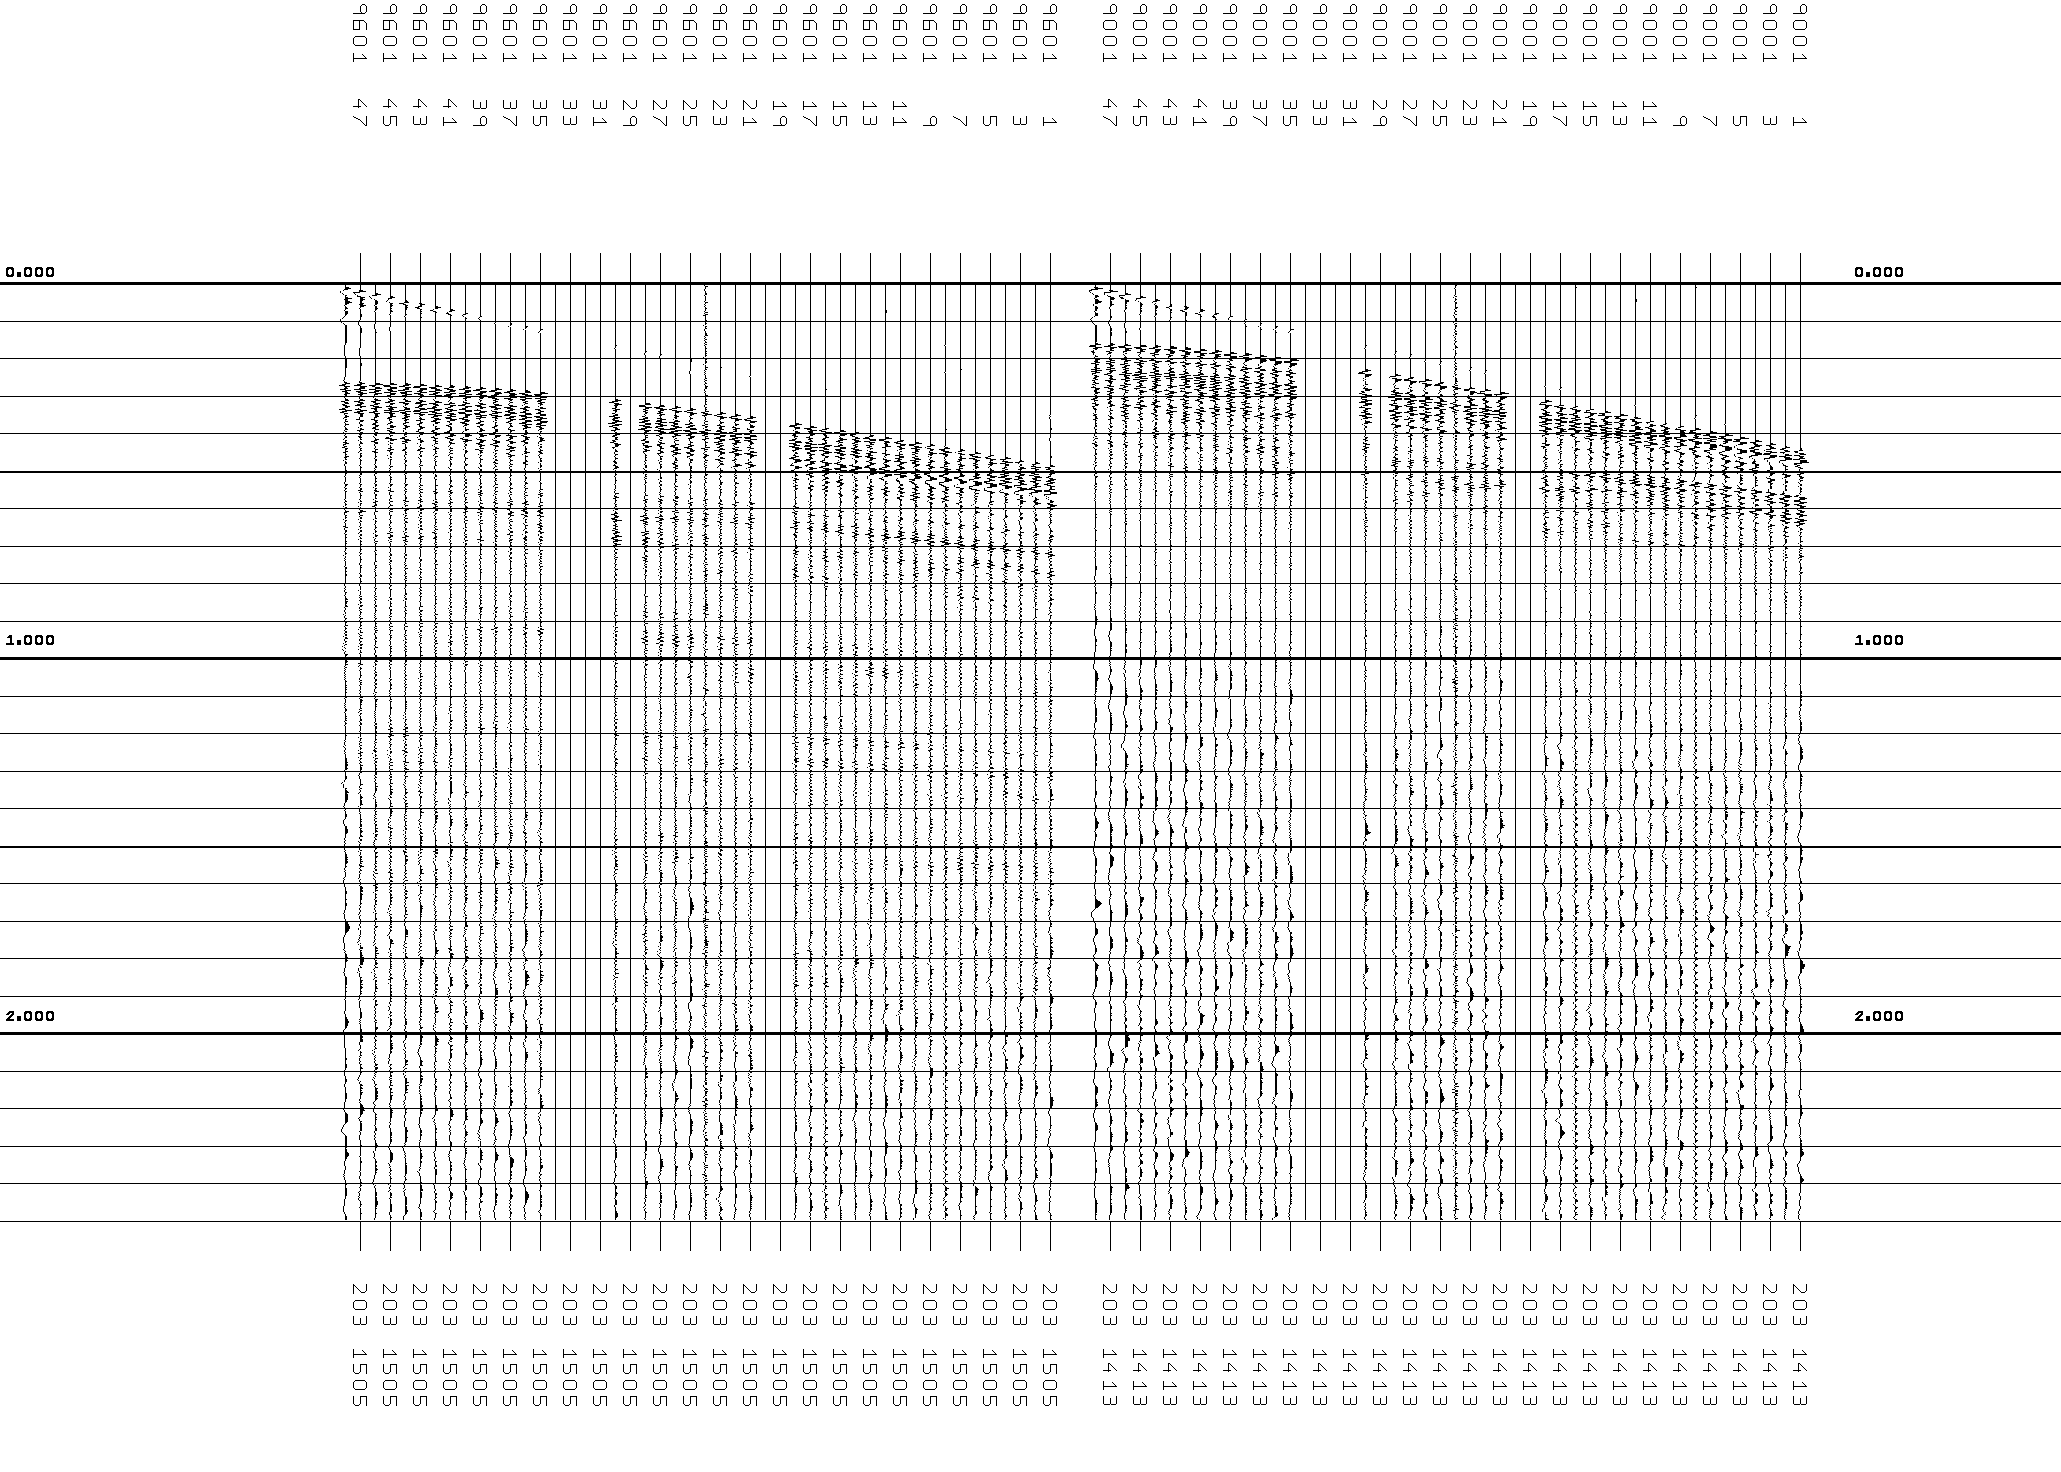
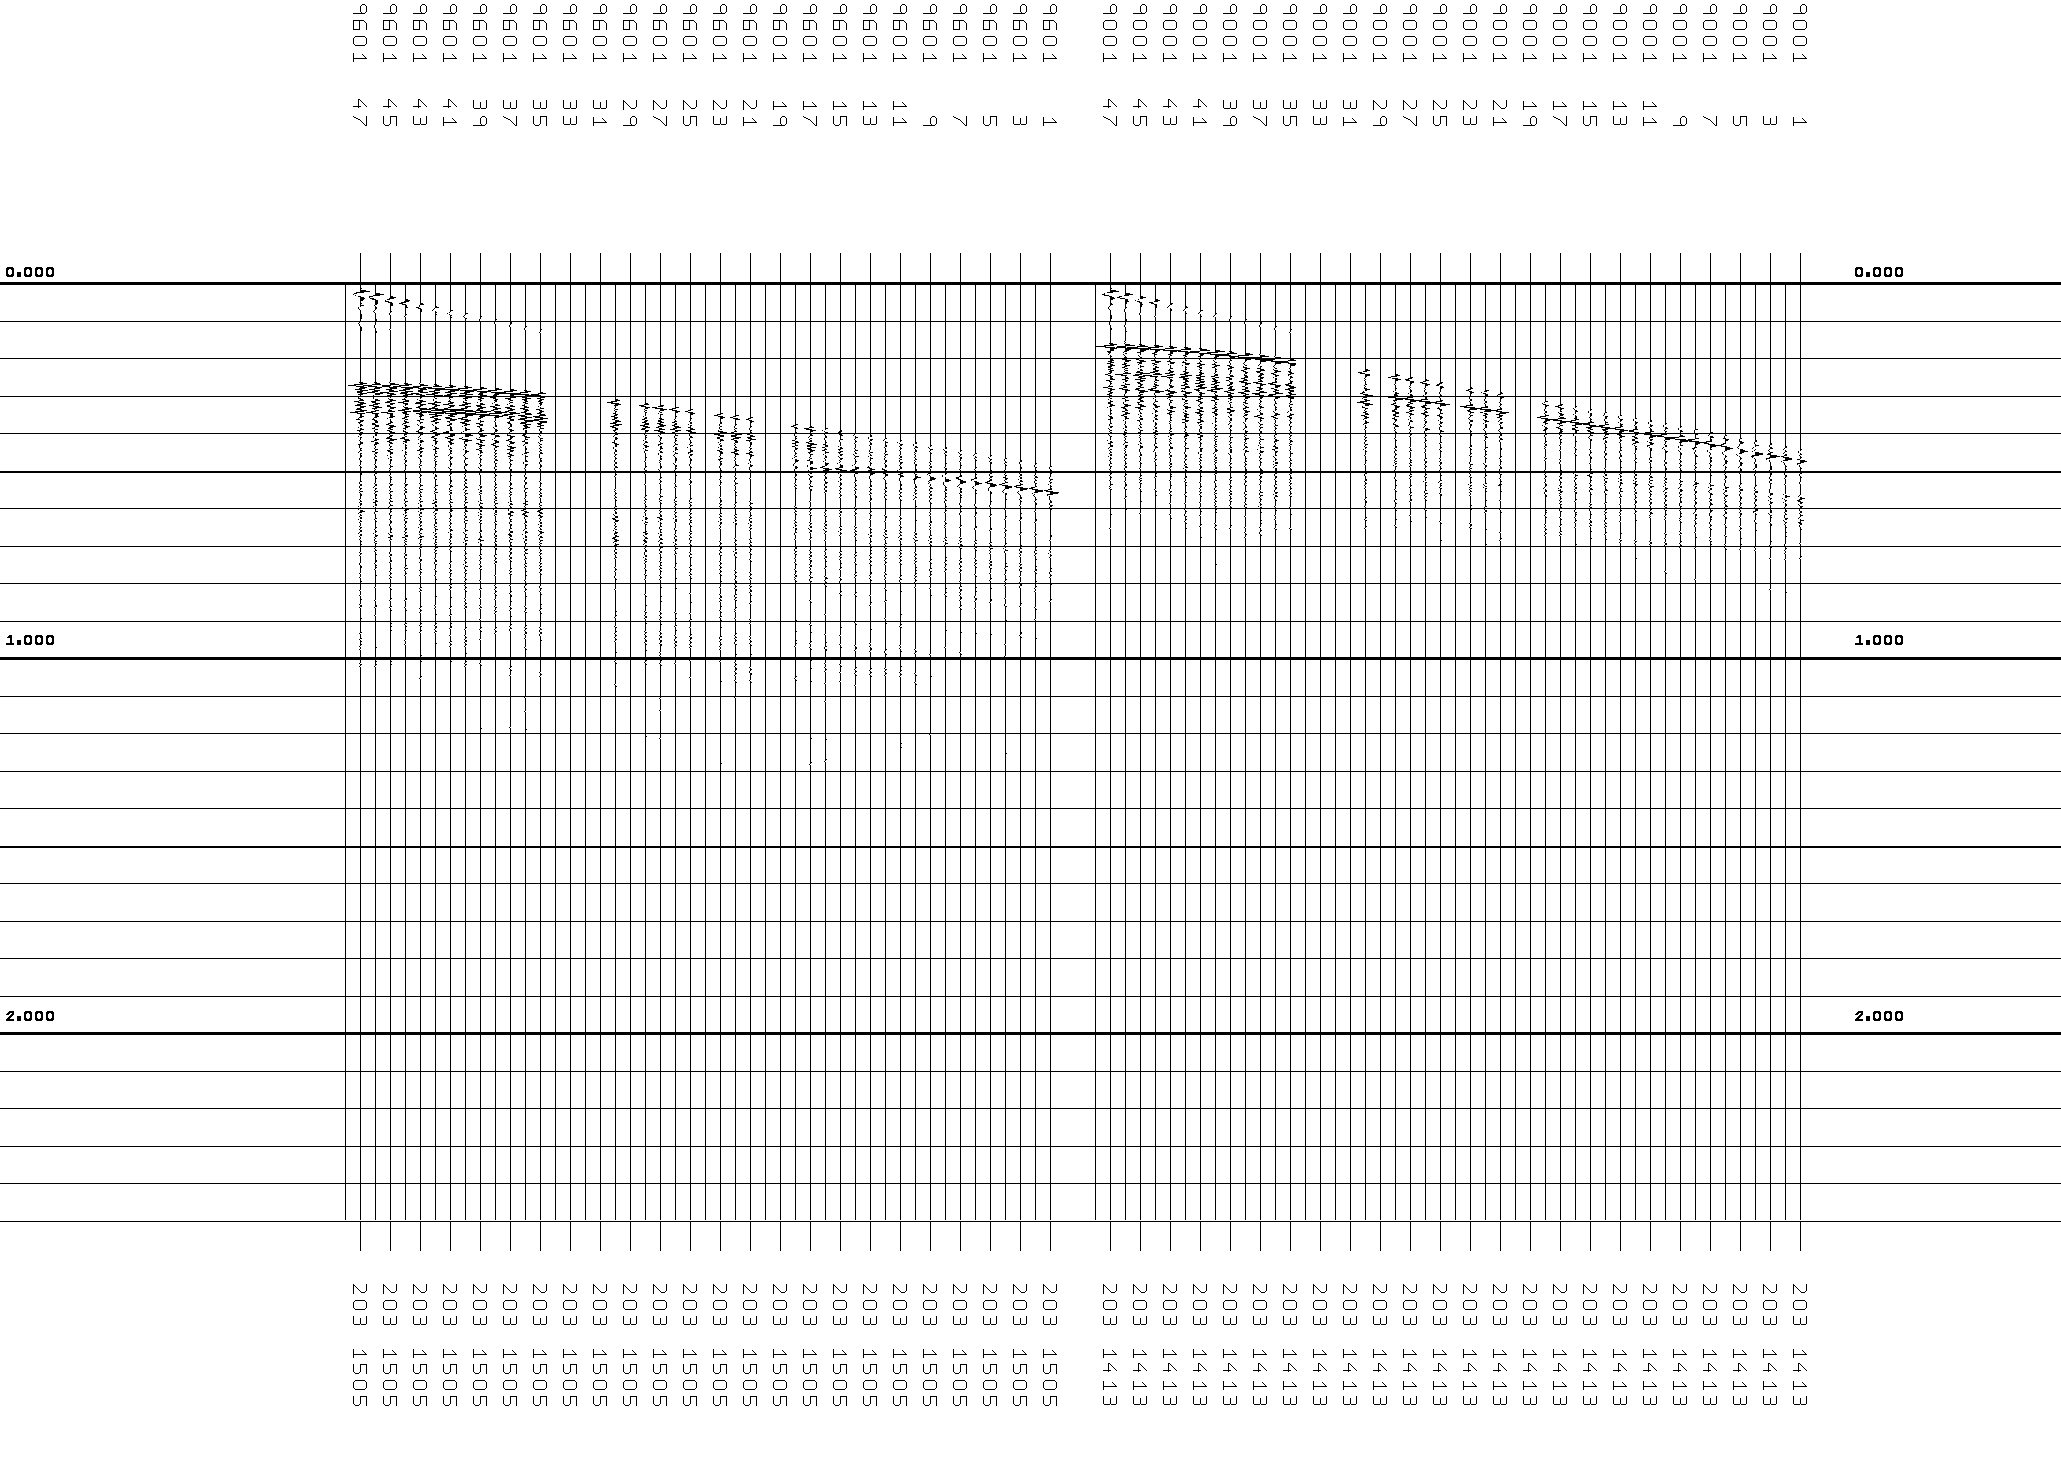
Script, Plot, shows the order of traces "flipped" Trace 48 is now closest to the guns. *** No clue why this was done. After trying recreate the gathers and trying use the NAV files, I suspect the binary NAV file must be ordered differently than what sioseis expects. The *Rev.segy files are a duplicate of the *Ren.segy files.
Find the dead/bad traces to kill
Script, no agc plot and with agc plot, are useful for identifying the bad traces. Note shot 9200 has spikes at .24 and 1.85. The spike occured before the recorder since the they are filtered and occur at the same time. Older datasets like this occasional have reverse polarity traces which are caused by a group being repaired with wires mixed or by the streamer section being connected incorrectly. This dataset does NOT have that problem. DIFFERENT WEIGHTS Script, plot, shows gmk's weighted/killed traces. Script, plot, shows pch's weighted/killed traces. gmk weights: twp 19 0 20 0 24 0 31 0 32 0 33 0 34 0 48 0 end pch weights: twp 19 0 20 0 29 0 31 0 32 0 33 0 34 0 end gmk has killed good trace 48 and has NOT killed bad trace 29. gmk also kills trace 24 but pch determined that trace 25 is good but at lower amplitude and in the gather below multiplies it by 2000. QC on raw data must be done on each line. Script, plot, shows gmk's weighted/killed traces with a filter and no agc. Plotting the shots without agc shows shows that not killing trace 29 might not hurt much in the stack because it's very low amplitude.NAVIGATION FILES
I can't figure out the nav files head Tjornes_line37.ascii 9001 0 12.899 4998.704 66084211 -17709471 801 746 793 What is this file? c_gather uses: type 3 navfil /net/aradraid/iceland.dir/nav/Tjornes_line37 end geom type 3 doc says: LDGO binary nav files may come from Lamont or may be generated by Graham Kent's 'navcmp' program which reads the Ewing 'ts.n*' file. LDGO binary nav files may come from Lamont or may be generated by Graham Kent's 'navcmp' program which reads the Ewing 'ts.n*' file. Tjornes_line37 is a binary file that doesn't is not for the data either. *** ERROR *** Could not find shot 9001 trace 1 in the l dgo nav file. lsd is a sioseis program made along with sioseis - make all 525>lsd day203-1413z.segy 48 | more SHOT TR RP TR ID RANGE DELAY NSAMPS SI YR DAY HR MIN SEC 9001 1 0 0 1 0 0.00 2500 1000 1981 203 14 13 44 9002 1 0 0 1 0 0.00 2500 1000 1981 203 14 13 49 9003 1 0 0 1 0 0.00 2500 1000 1981 203 14 13 55 9004 1 0 0 1 0 0.00 2500 1000 1981 203 14 14 0 9005 1 0 0 1 0 0.00 2500 1000 1981 203 14 14 6 (the year is corrected in sioseis scripts for testing geom and gather) 549>head ts_line37 2001+203:18:13:56.700 9167 N 66 4.8227 W 17 40.6827 TFZ37 is after the segy files I have jul2cal for year 2001 julian day 203 gave month 7 day 22 cal2jul and jul2cal are sioseis programs made along with sioseis - make all Look at other ts files for the segy shot times. ts_line34 has similar times. 527>grep "14:13:4" ts_line34 2001+203:14:13:43.393 6405 N 66 11.2256 W 17 42.4946 TFZ34 2001+203:14:13:48.310 6406 N 66 11.2197 W 17 42.5013 TFZ34 2001+203:14:13:53.216 6407 N 66 11.2138 W 17 42.5125 TFZ34 2001+203:14:13:58.204 6408 N 66 11.2078 W 17 42.5204 TFZ34 .... 2001+203:15:10:28.591 7077 N 66 7.1294 W 17 47.6946 TFZ34 Create perl file ts2sio.pl" from geom document page and chmod 777 mv ts2sio.pl > ~/bin perl ~/bin/ts2sio.pl ts_line34 > sio_line34 sio_line34 has: 2001 203 14 13 43.393 66 11.2256 -17 42.4946 6405 2001 203 14 13 48.310 66 11.2197 -17 42.5013 6406 2001 203 14 13 53.216 66 11.2138 -17 42.5125 6407 2001 203 14 13 58.204 66 11.2078 -17 42.5204 6408 GEOM type 6 had a bug fixed in SIOSEIS ver 2025.1.2 (13 Oct 2025) Now the problem is the last nav in ts_line34 is: but the last SEGY shot is: 9900 1 0 0 1 0 0.00 2500 1000 1981 203 15 31 26 1 ts_line35: 2001+203:15:28:22.803 7267 N 66 6.6238 W 17 45.2564 TFZ35 . 2001+203:16:29:21.527 7973 N 66 10.9805 W 17 40.0069 TFZ35 579>head ts_line36 2001+203:16:43:32.273 8134 N 66 10.3214 W 17 38.6883 TFZ36 580>cat ts_line34 ts_line35 > ts_line34+35 583>perl ~/bin/ts2sio.pl ts_line34+35 > sio_line34+35 let's make shot 9877 the last 9877 1 0 0 1 0 0.00 2500 1000 1981 203 15 29 28 1ANALYSYS OF SHOT DATA - WAVE TYPES
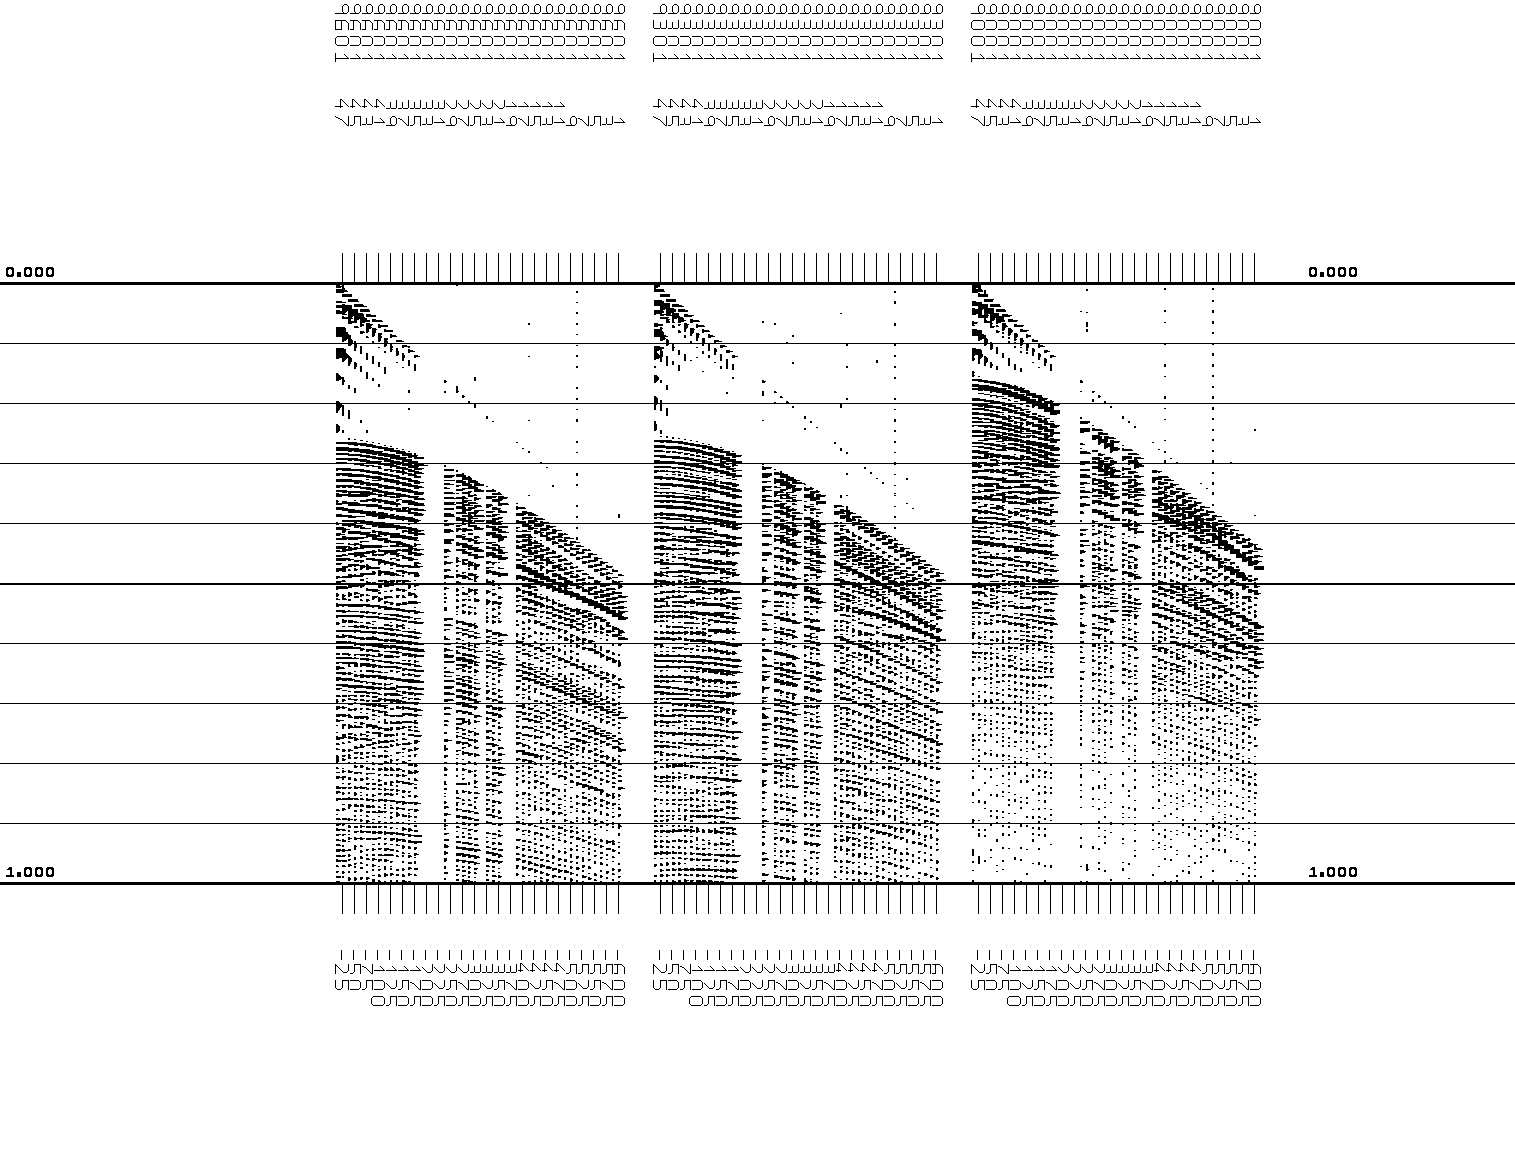
Let's figure out what type of waves are in the shot data. Script, plot, has a different type of plotting which shows the different types of waves. Adding NMO with water velocity is much more revealing. Script, plot, is more informative. The strong event on the long ranges I suspect is a reflection off a fjord wall. The ship is moving away from the wall which is why the two-way travel time is long on the traces closest to the ship/guns. The event is also "deeper" as the ship moves away from the wall. There are some other waves with the same slope and I suspect these are interbed multiples of that fjord wall reflection. These events are perfectly straight at water velocity indicating a water wave. FKFILT should remove this - from moved out shots. move-out at water velocity, fk-filter, move-in. Note that everything below the base layer is higher frequency. This tells me that not much energy is getting through the sediments. The plot also shows the effect of nmo stretch (wavelet stretch which appears as lower frequency) on the longer traces. We remove that with process MUTE. Mute times are "hung" off the water bottom (hanging parameters from the water bottom is unique to SIOSEIS).SHORT TRACE GATHER
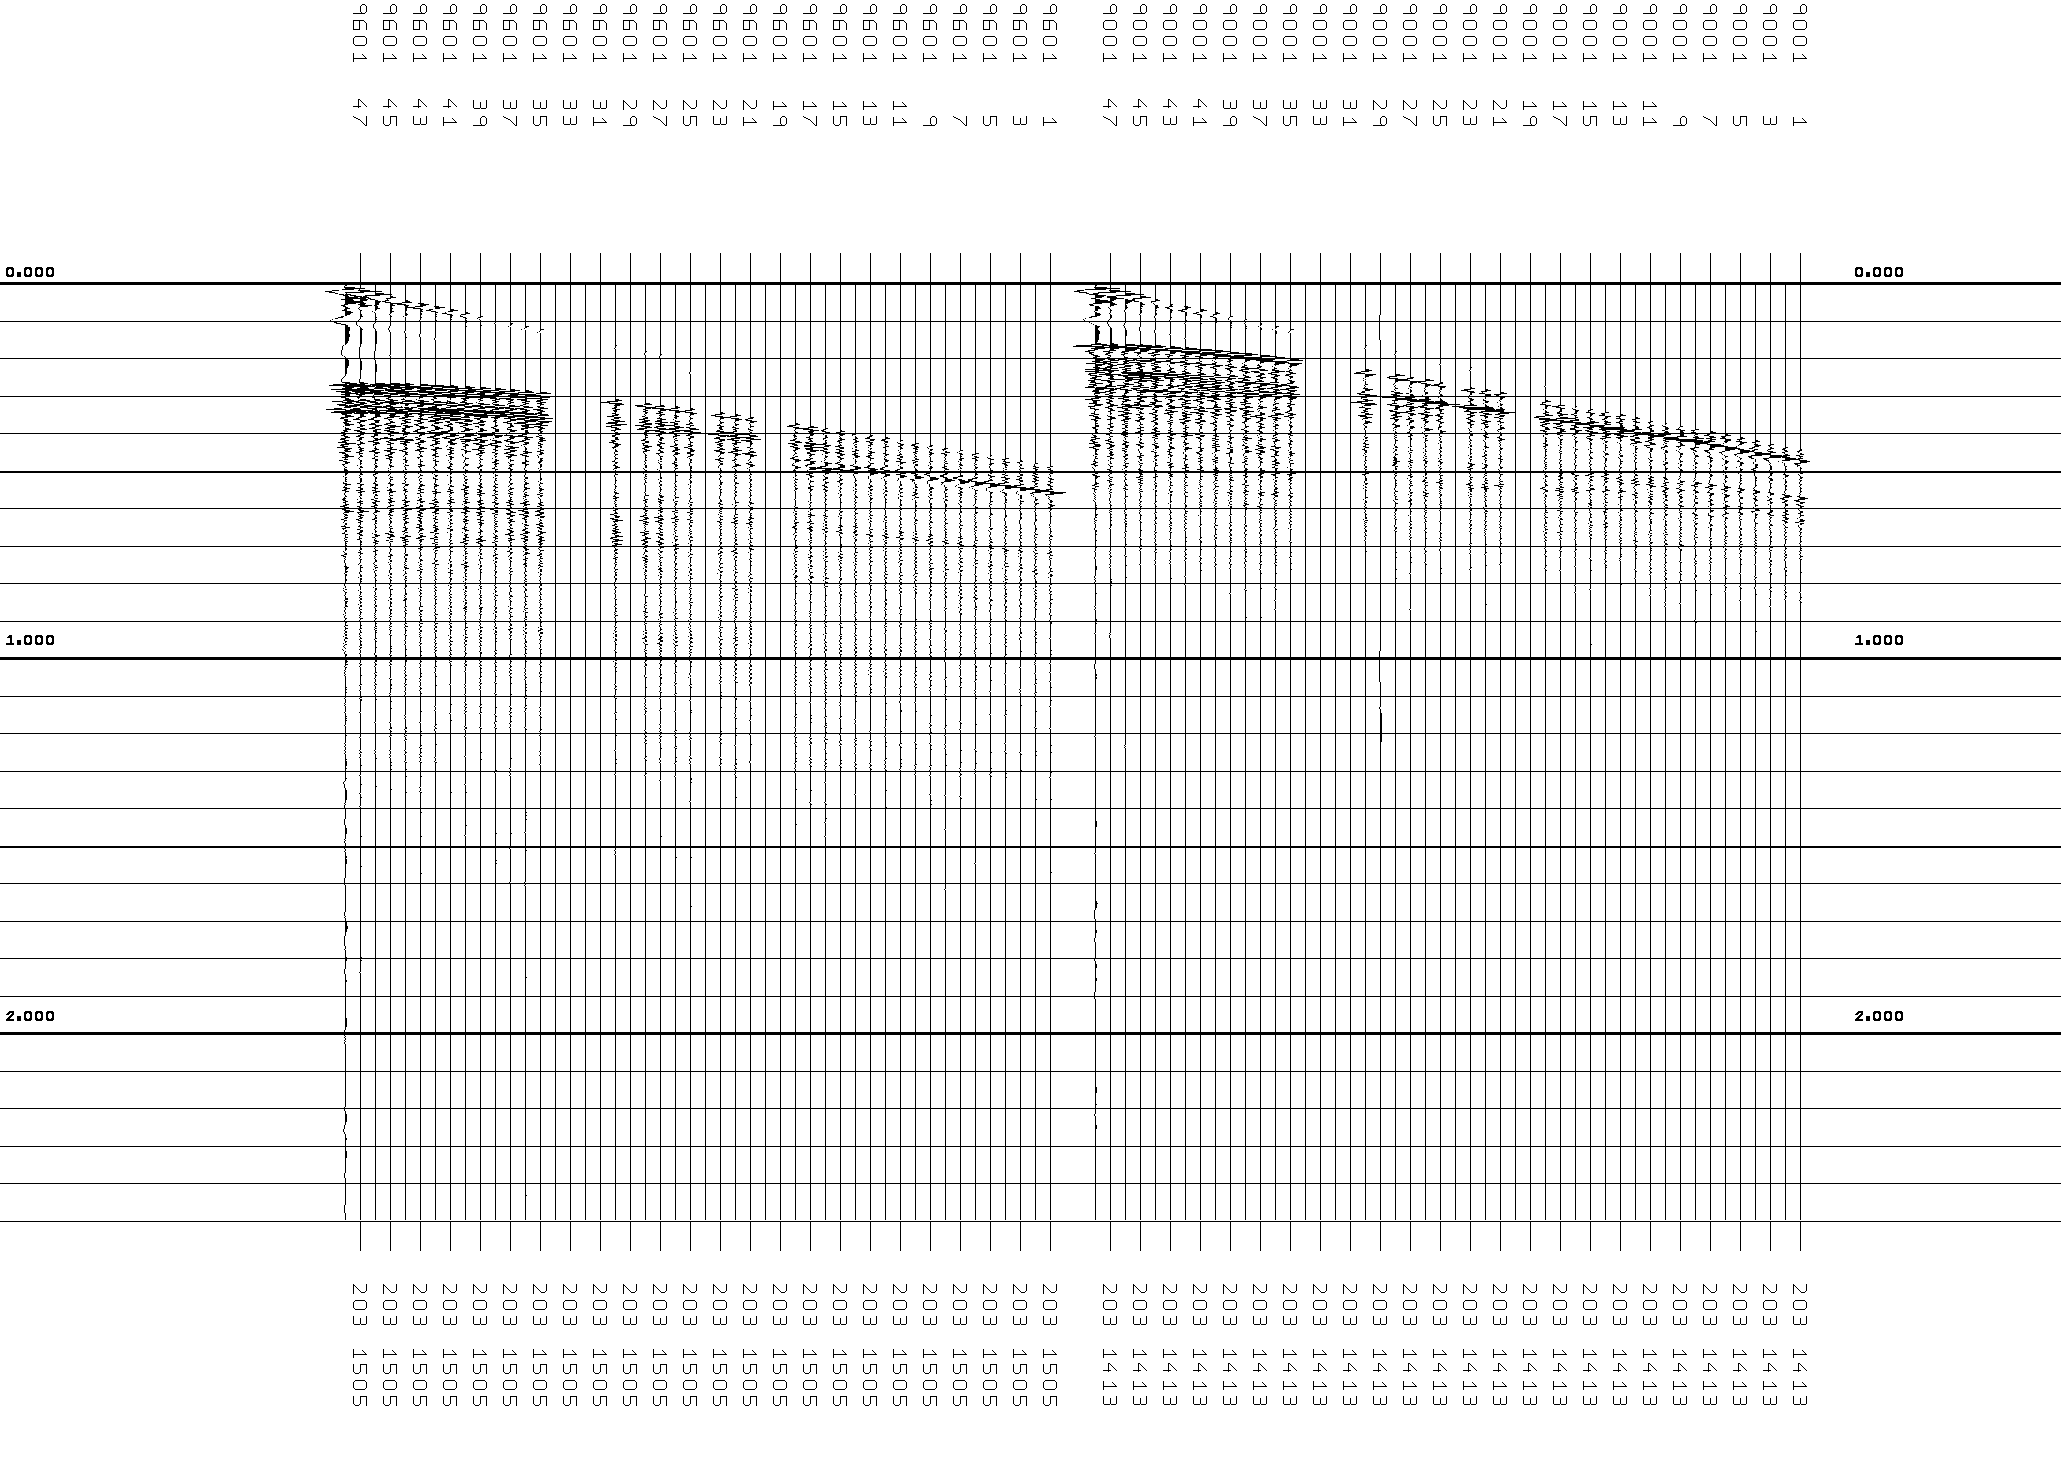
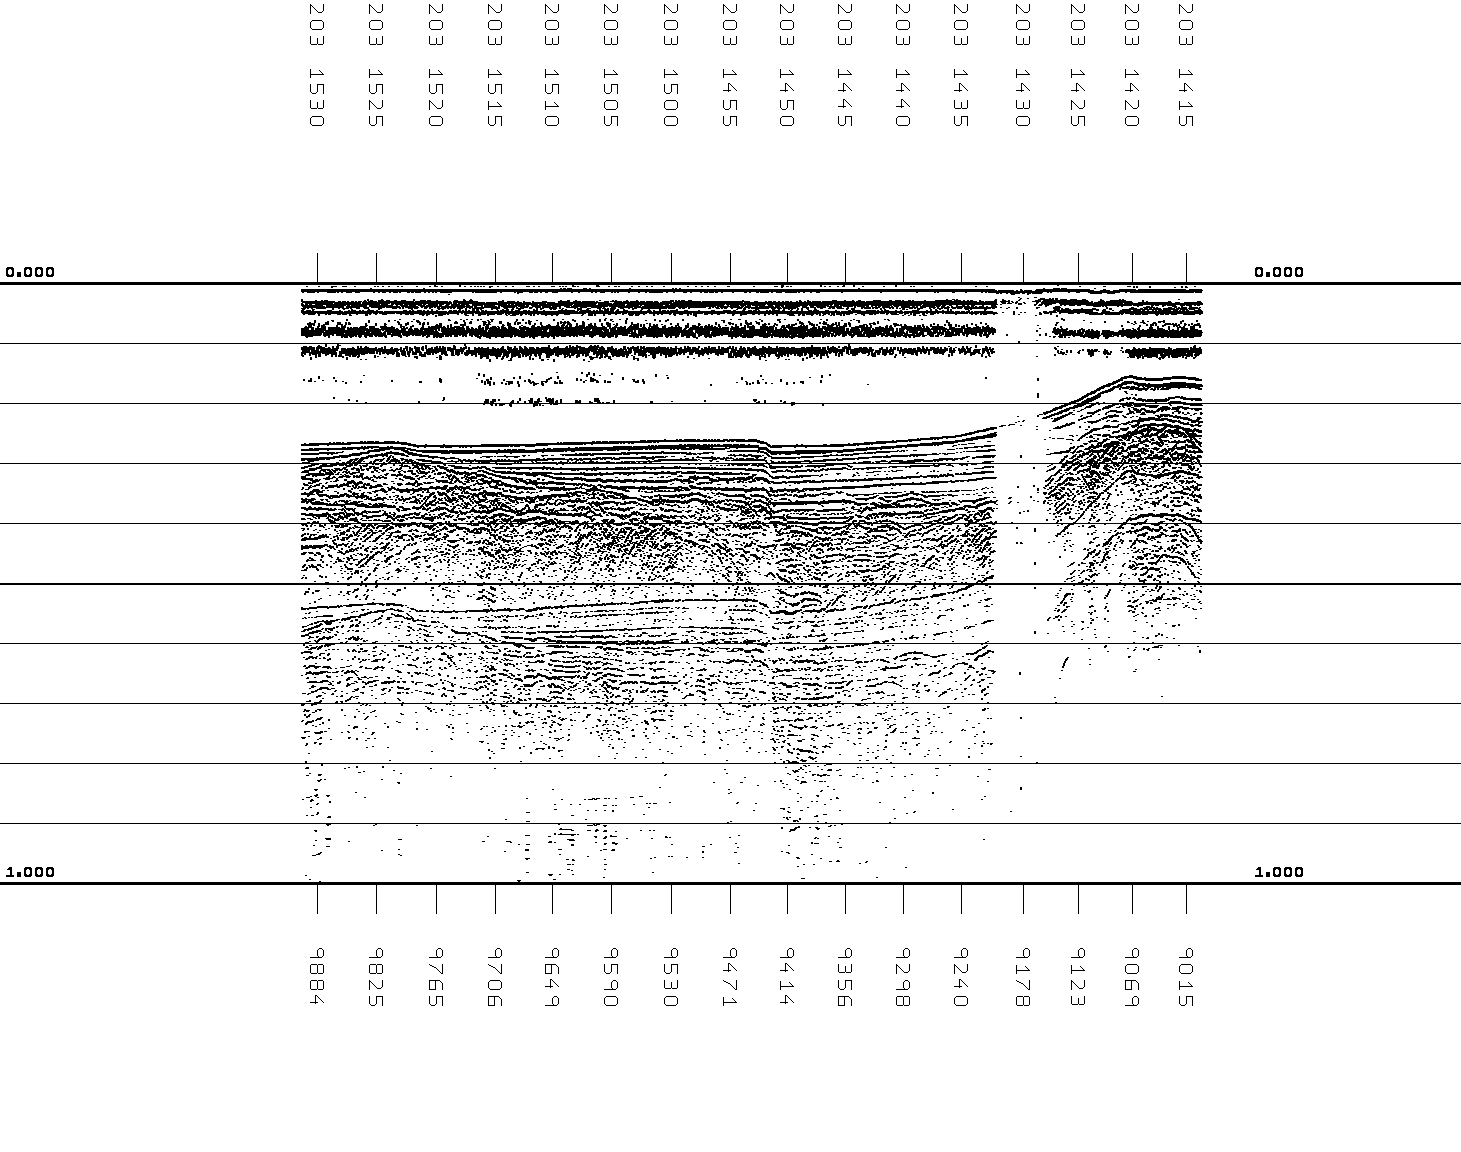
One of my favorite starting points on data sets I know nothing about about is to plot all the traces closest to the gun. Short trace gathers. Script, plot, shows the trace closet to the guns and every shot. There's a major problem around day 203 1426z-1433z (shots 9121-9240). It looks like there's still something there but at much lower amplitude. What does the recorder's log say? Just curious. Let's look at the shots in that area.ANALYSING THE BAD SHOTS
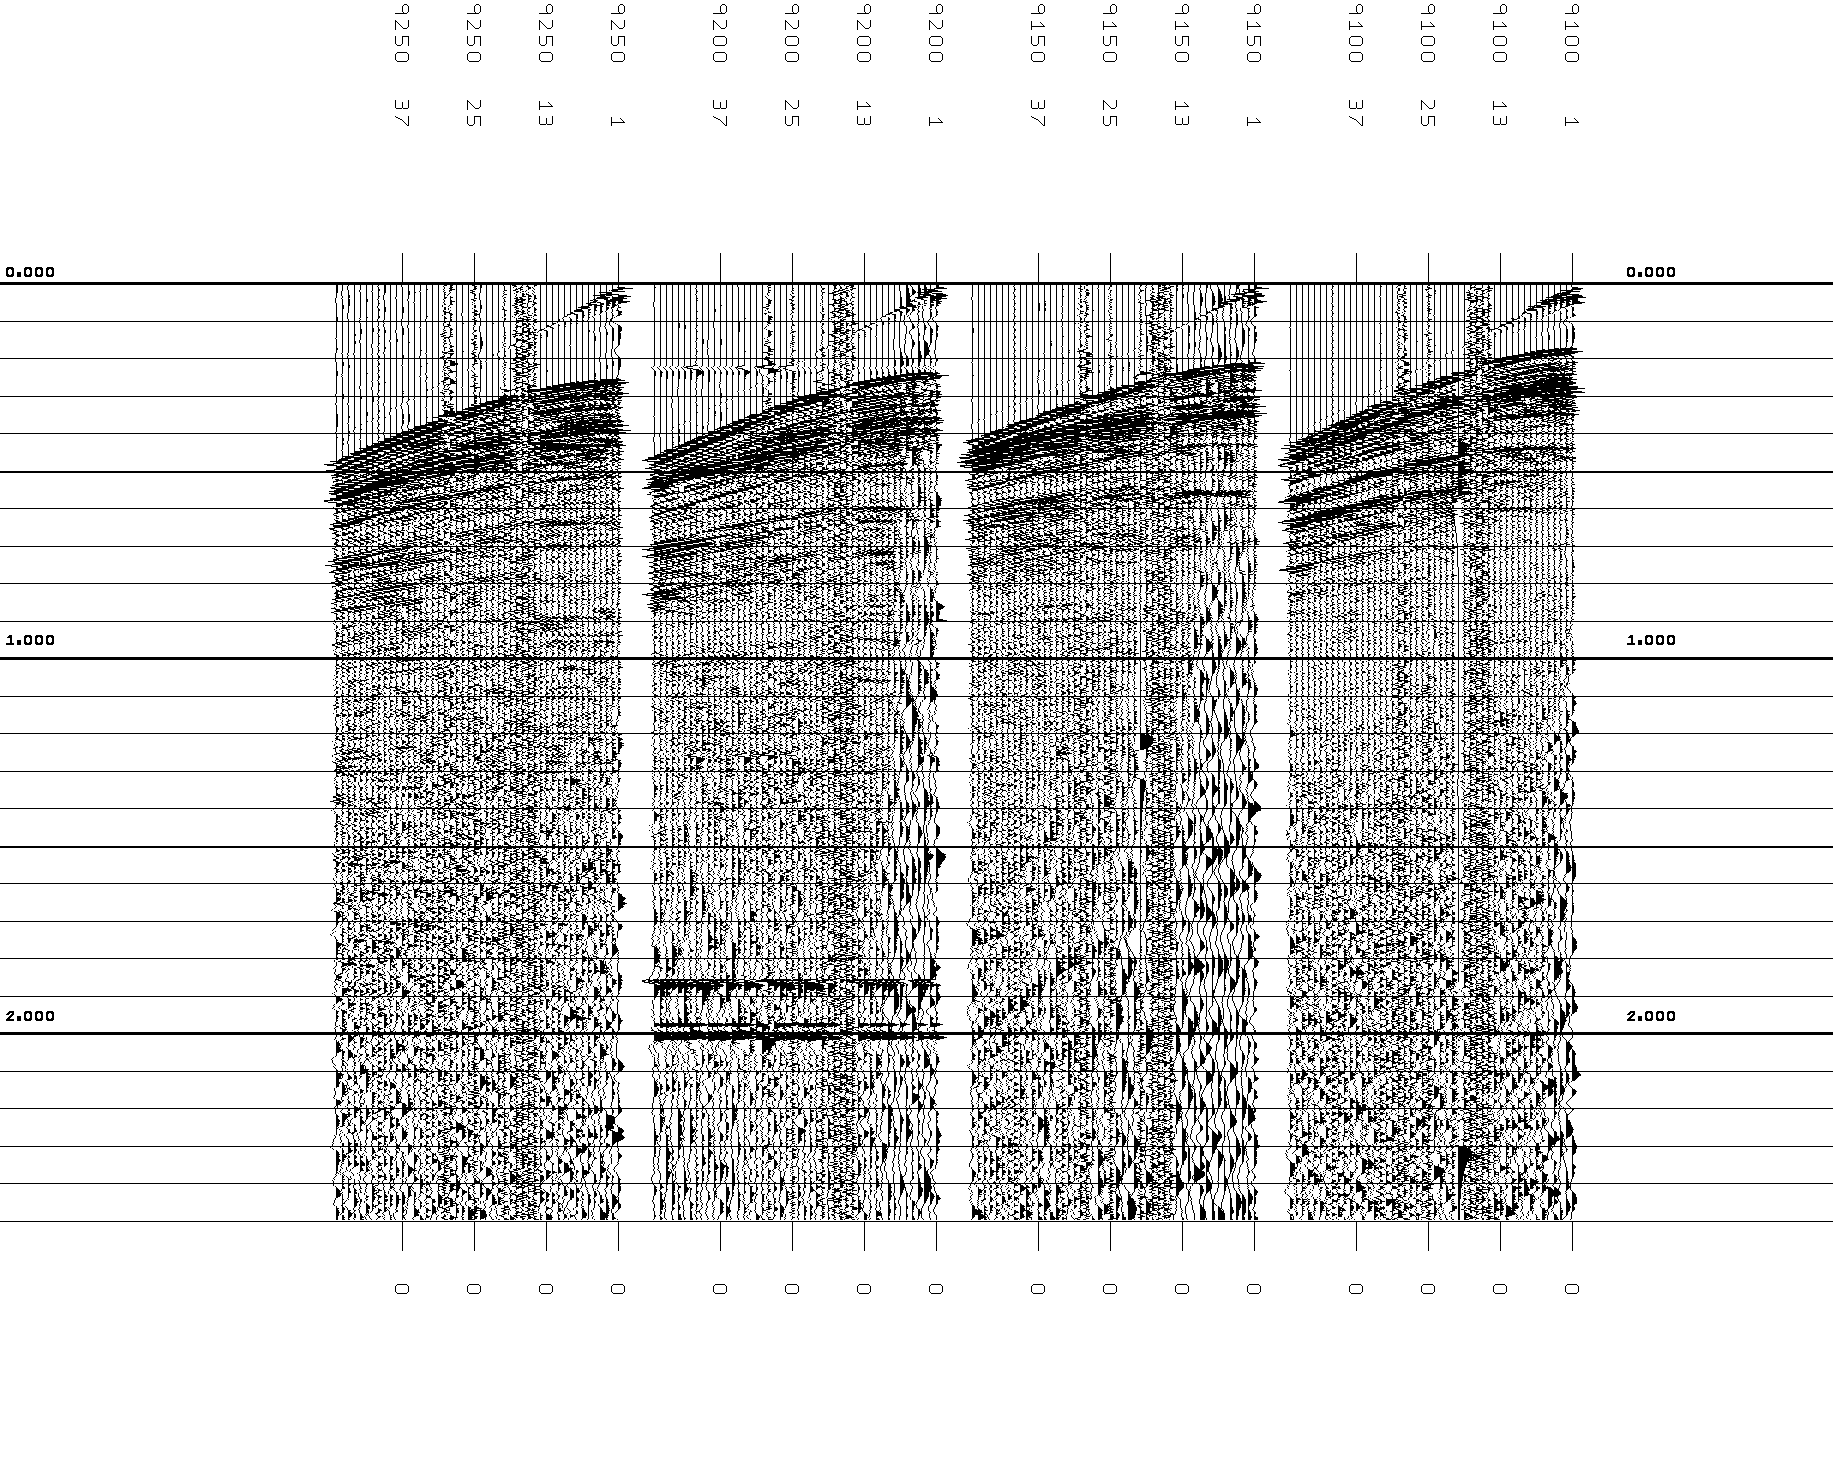
Something is wrong with shots around 9121 through around 9240. The following plots have good shots 9100 and 9250 and bad shots 9150 and 9200 (diskin fno 9100 lno 9250 noinc 50) Script, plot, shows all traces with the same scalar The script also generated statisics for every trace using prout parameter INFO 1 and redirecting STDOUT to file Script Note that this used the original .Raw file and the traces/streamer has not been flipped. plot, is the same but with plot parameter scalar 0 (each trace scaled the largest amplitude the same as plot trace 1). Still no insight other than an electrical spike at .021 on shot 9200. (The spike has been filtered by the recorder, so problem might be the streamer connection to the recorder). Script, plot, enlarges the first .5 seconds. Perhaps just killing the first 12 traces (2 streamer sections)? plot has nmo v=1500 We can do all the killing/weighting after gather as long so create a list of shot trace numbers vs ranges.USE THE RAW DATA RATHER THAN REN (FLIPPED STREAMER)
Note that I am using the original raw data (not gmk flipped streamer) Script, raw_geom_nmo_plot>, for picking the bad traces. We can check the geom parameters by looking at the annotation at the bottom of the plot. I chose twp 15 0 16 0 17 0 18 0 20 0 25 2000 29 0 30 0 end I chose weighting/multiply trace 25 by 2000 by trial and error. The agc plot showed it had data. Nothing in the statiscs jumped out. raw_geom_weight_nmo_plot, after weighting. This was an exercise that I probably would not ordinarily do since 1 trace in 24 trace stack doesn't contribute much. But there are 7 bad traces.MAKE CMP GATHERS
Script mk_gathers creates file g_line37.segy Because trace 1 is closest to the ship, it is considered a flipped streamer and in order to get the CMP taper, use GATHER parameter FRP (use FRP = RPADD - NTRCS, where NTRCS is what was used in GEOM)VELOCITIES THEN NMO STACK FILTER
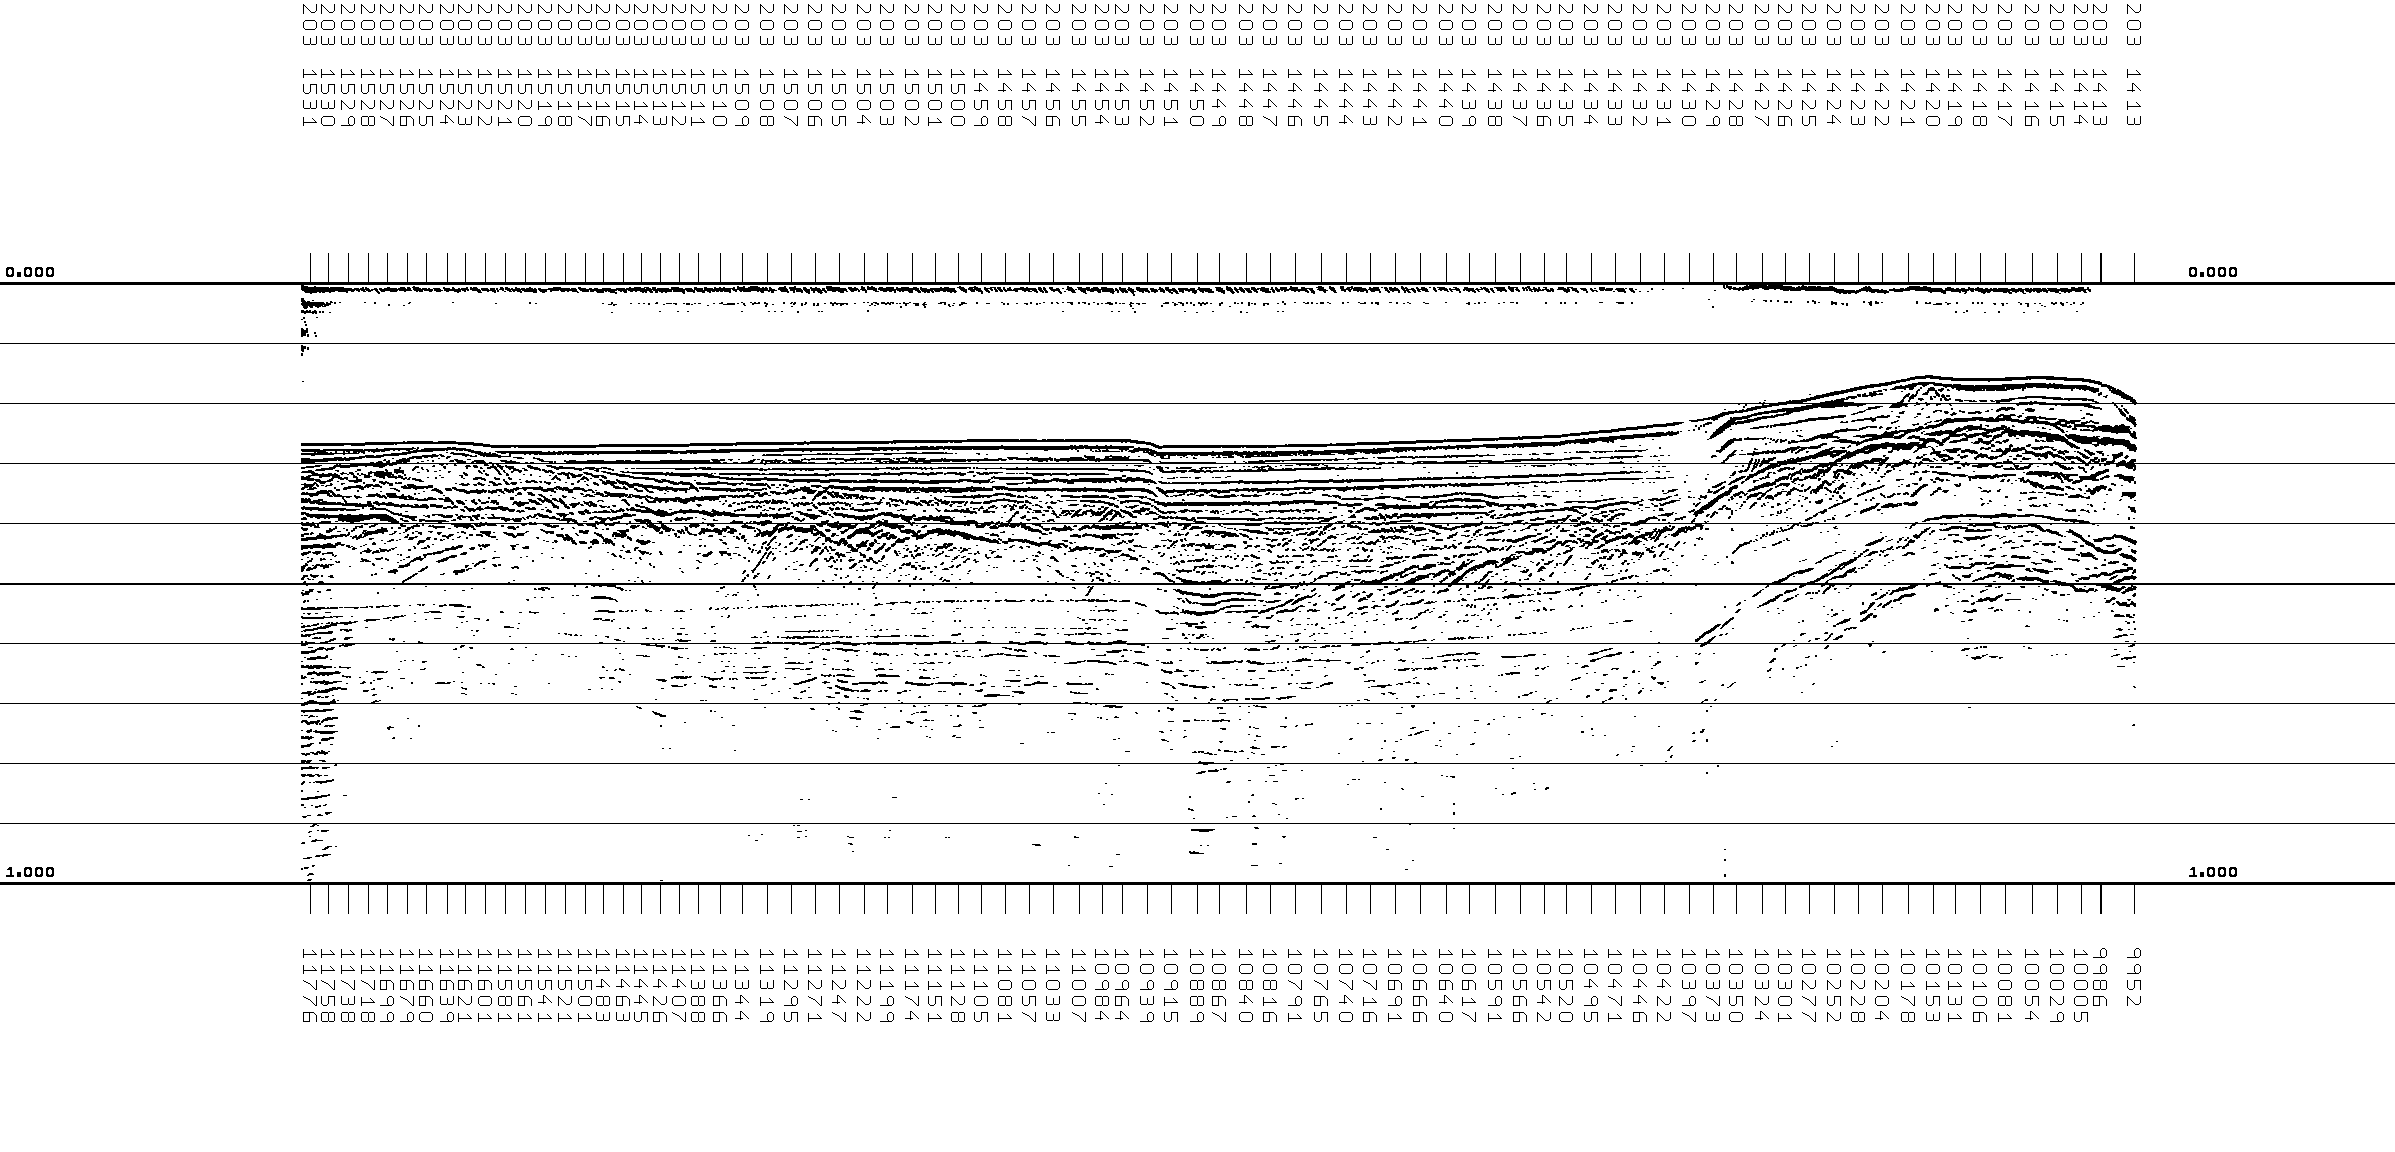
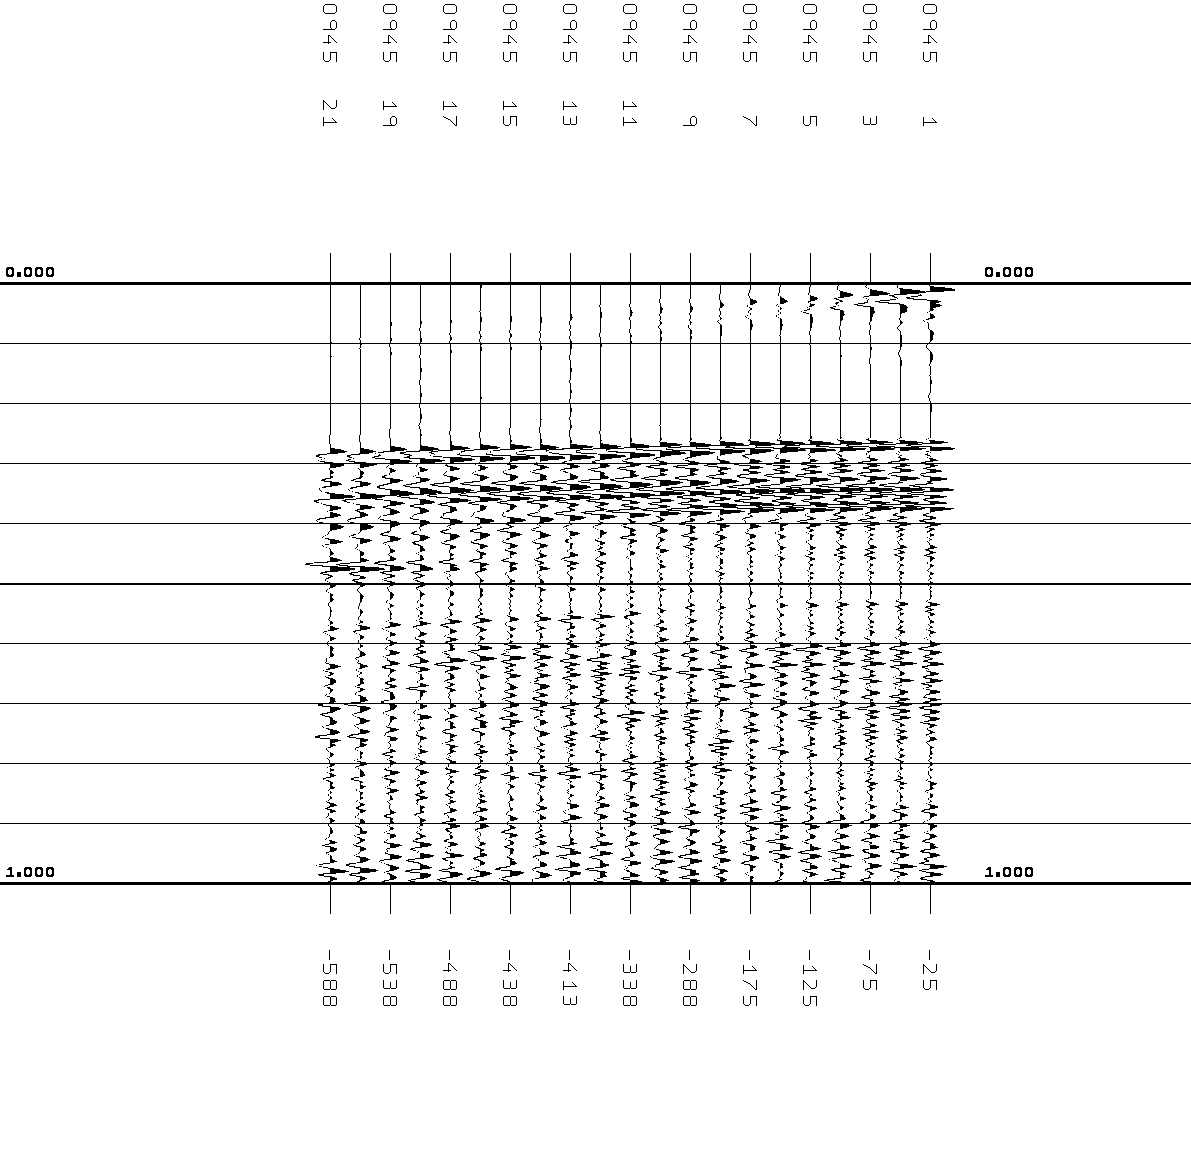
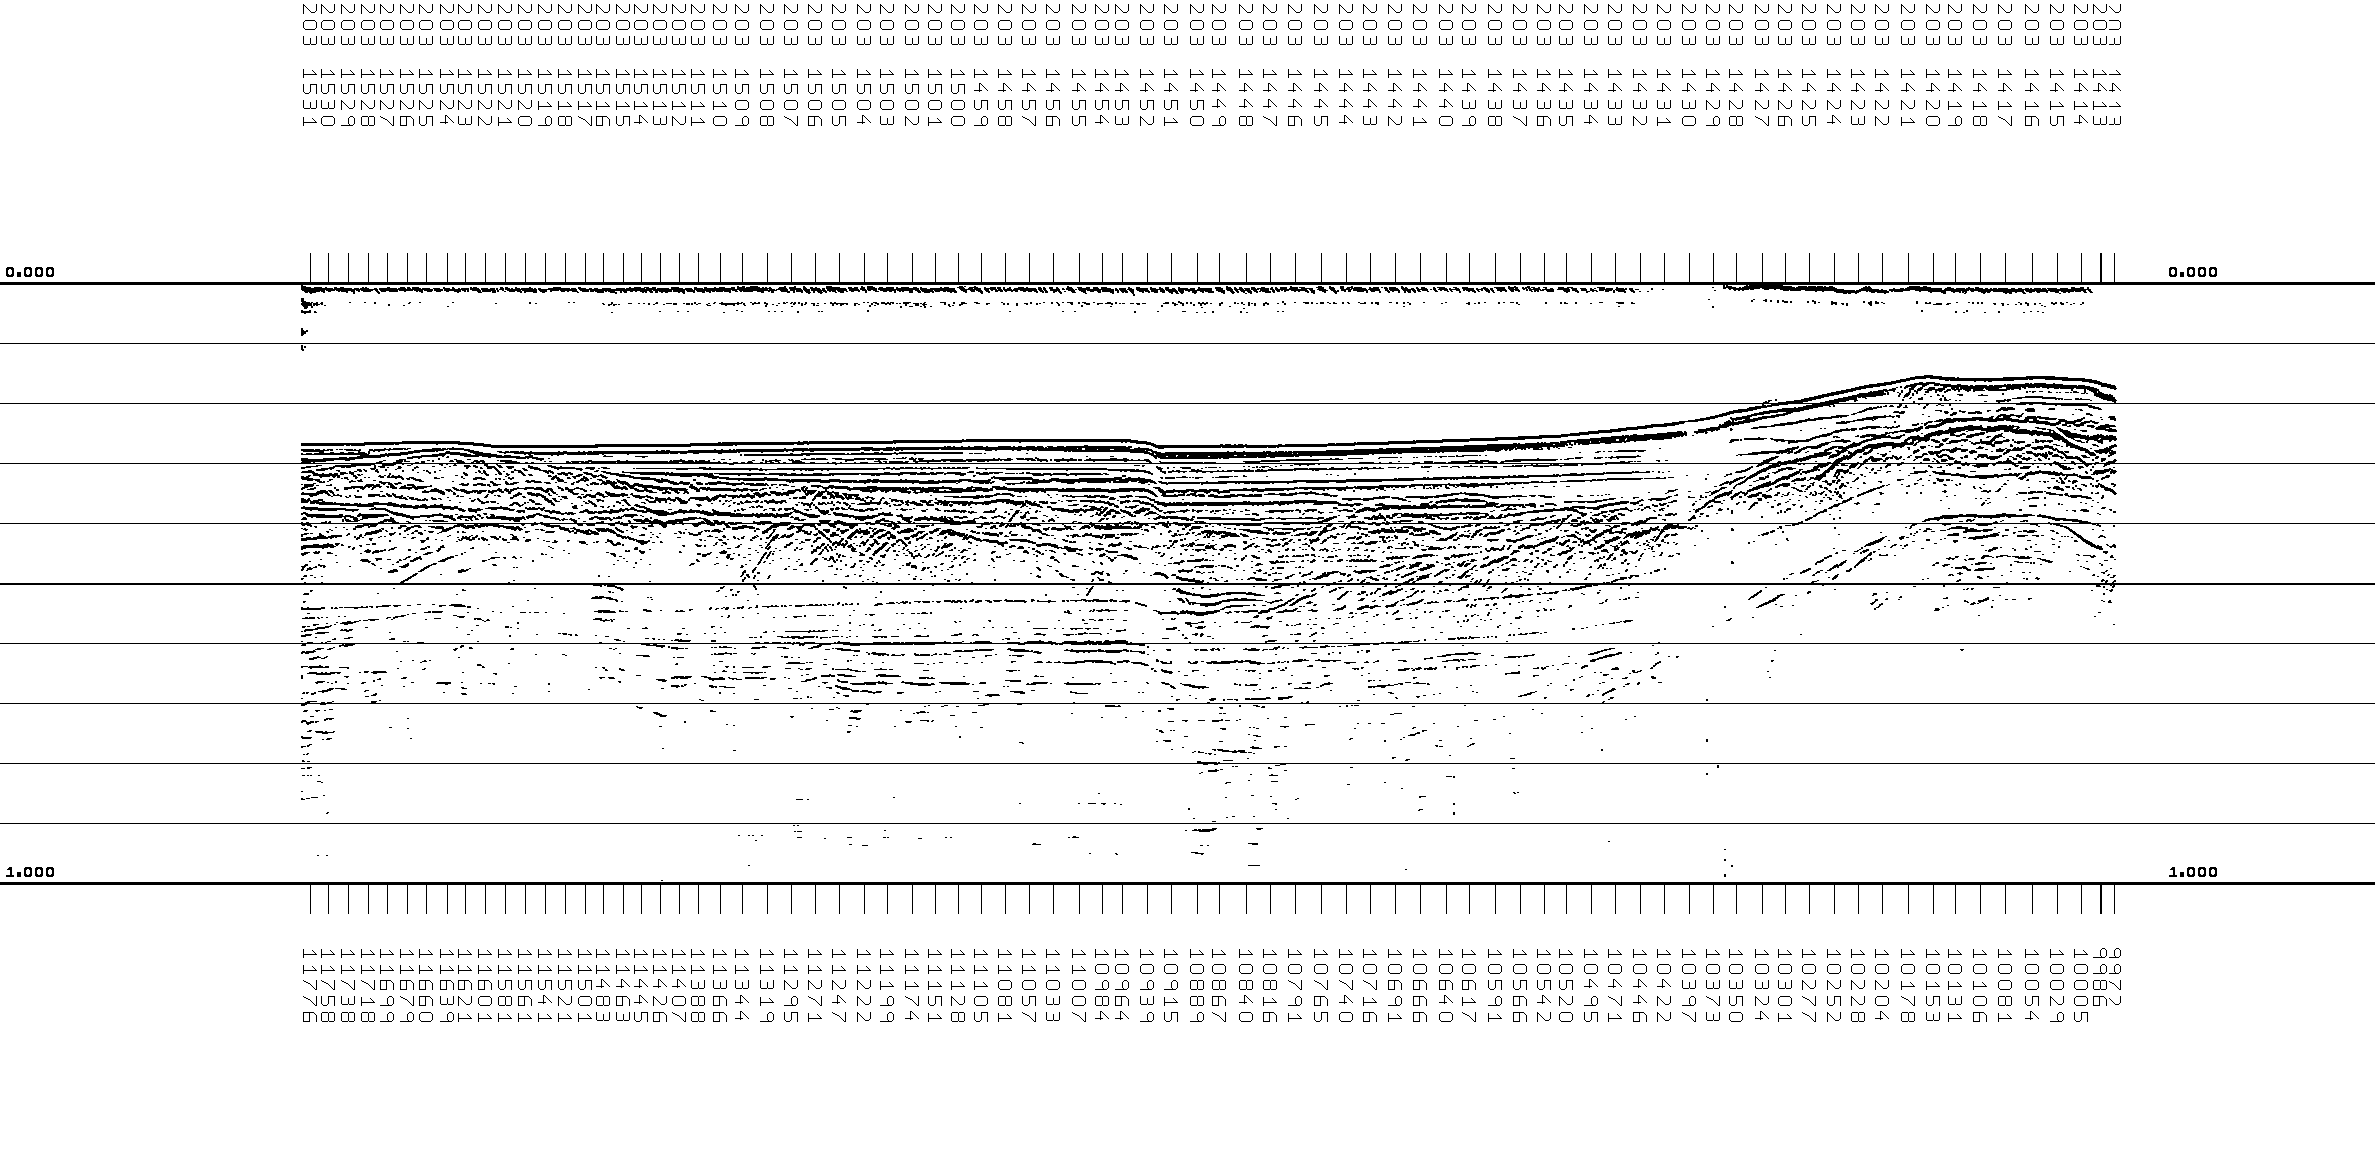
My favorite velocity picking method was using process VELAN TYPE SPEC (velocity spectra) with Matlab to contour and pick. I no longer have Matlab). It appears that GMK used VELAN TYPE VELS and a perl program. By using the shot times from gmk's gathers and pch's gathers I was able to convert gmk's velocity picks to pch's gather numbering. Not normally needed so details omitted here. Script mk_stack procs diskin nmo stack filter plot end with the gmk velocities. nmostk.png is the plot. Checking what goes into a stacked trace is a useful exercise. Script mk_stack procs diskin nmo filter agc plot end is just rp 10945 because it's one of the stack traces where the velocity is specified. The script show the work converting from gmk's numbering scheme to pch's. gmkv10945.png shows rp 10945 using gmk's velocity. fno 10945 lno 10945 vtp 1500 0.259 1550 0.326 1700 0.455 end 1. the velocities are not perfect. 2. the longer ranges show nmo stretch on the water bottom. Muting just the water bottom on the longer ranges is probably too hard. 3. The event at .49s is probably a refraction because it's only on the longer ranges. FKFILT on the shots should get rid of that. 4. The event at 4.8 is the water bottom. Note higher frequency. Using a much higher velocity on everything below basement will cause the multiple to misalign more and cancel during stack. Just using the shorter ranges in the stack is an easy trick. Script mk_stackprocs diskin header geom weight gather nmo stack filter plot end Compare short_range_stk.png with nmostk.png Use two browser windows. A couple of observations: 1. Notice the difference in the shallow around 203 1429z 2. The fault at 1452z is better with all traces.(yes?) 3. The multiples are cancelled much better with the longer ranges included. This is because the longer ranges have more move-out and when moved-out with higher velocities they cancel out in stack. TO BE CONTINUED IN A FEW WEEKS To do: 1. Adjust the velocities so the stack is better (certainly the water bottom) and increase the velocities below basement. 2. Pick the water bottom and hang mutes 3. Examine & repair bad shots at 4. Spherical spreading - See "Seismic Data Processing" by Yilmaz 5. FKILTER the shots. Must be done on shots. 6. Finally do the migration.